A thousand gallons delivered to a large meter in Douglas County, Georgia, costs $24.80 once it is sent back to the sewer. The authority’s current chart splits that into $12.10 for the water in the top tier and $12.70 for the treatment. The same thousand gallons in Baton Rouge costs $1.51 from the water company and $7.17 from the parish sewer, $8.68 together. An open cooling tower rejecting 50 MW of heat needs about 300 million gallons a year, so with a sewer deduct meter in place the gap between those two sheets is $3.6 million a year for the same plant. The Open Factory Datacenter MEP Cost Table now holds the water and sewer tariff for every one of the 15 markets in the Large-Load Cost Table, and this piece is the first side-by-side.
The bars run from $24.80 in Douglas County and $23.96 in Santa Clara through $21.14 in Houston to $9.43 in Denver and $8.68 in Baton Rouge, and the sewer segment is the larger of the two in eleven of the fifteen rows. The piece covers the gallons a tower needs, the fifteen tariff sheets in one table, what Google, Microsoft and Meta disclose, the wet-bulb and dry-bulb hours that decide which machine works where, the fan penalty of going dry, the ten-year breakeven by market, why the water fights are about permits rather than bills, and, behind the wall, the 50 MW bill of materials three ways with the vendor shortlist.
The Gallons a Tower Needs
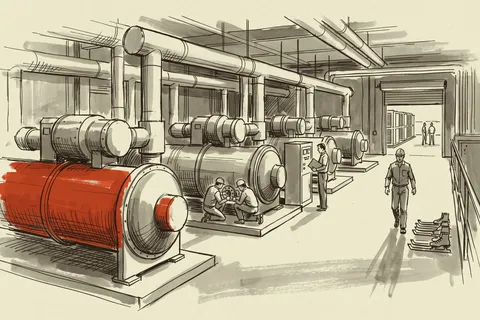
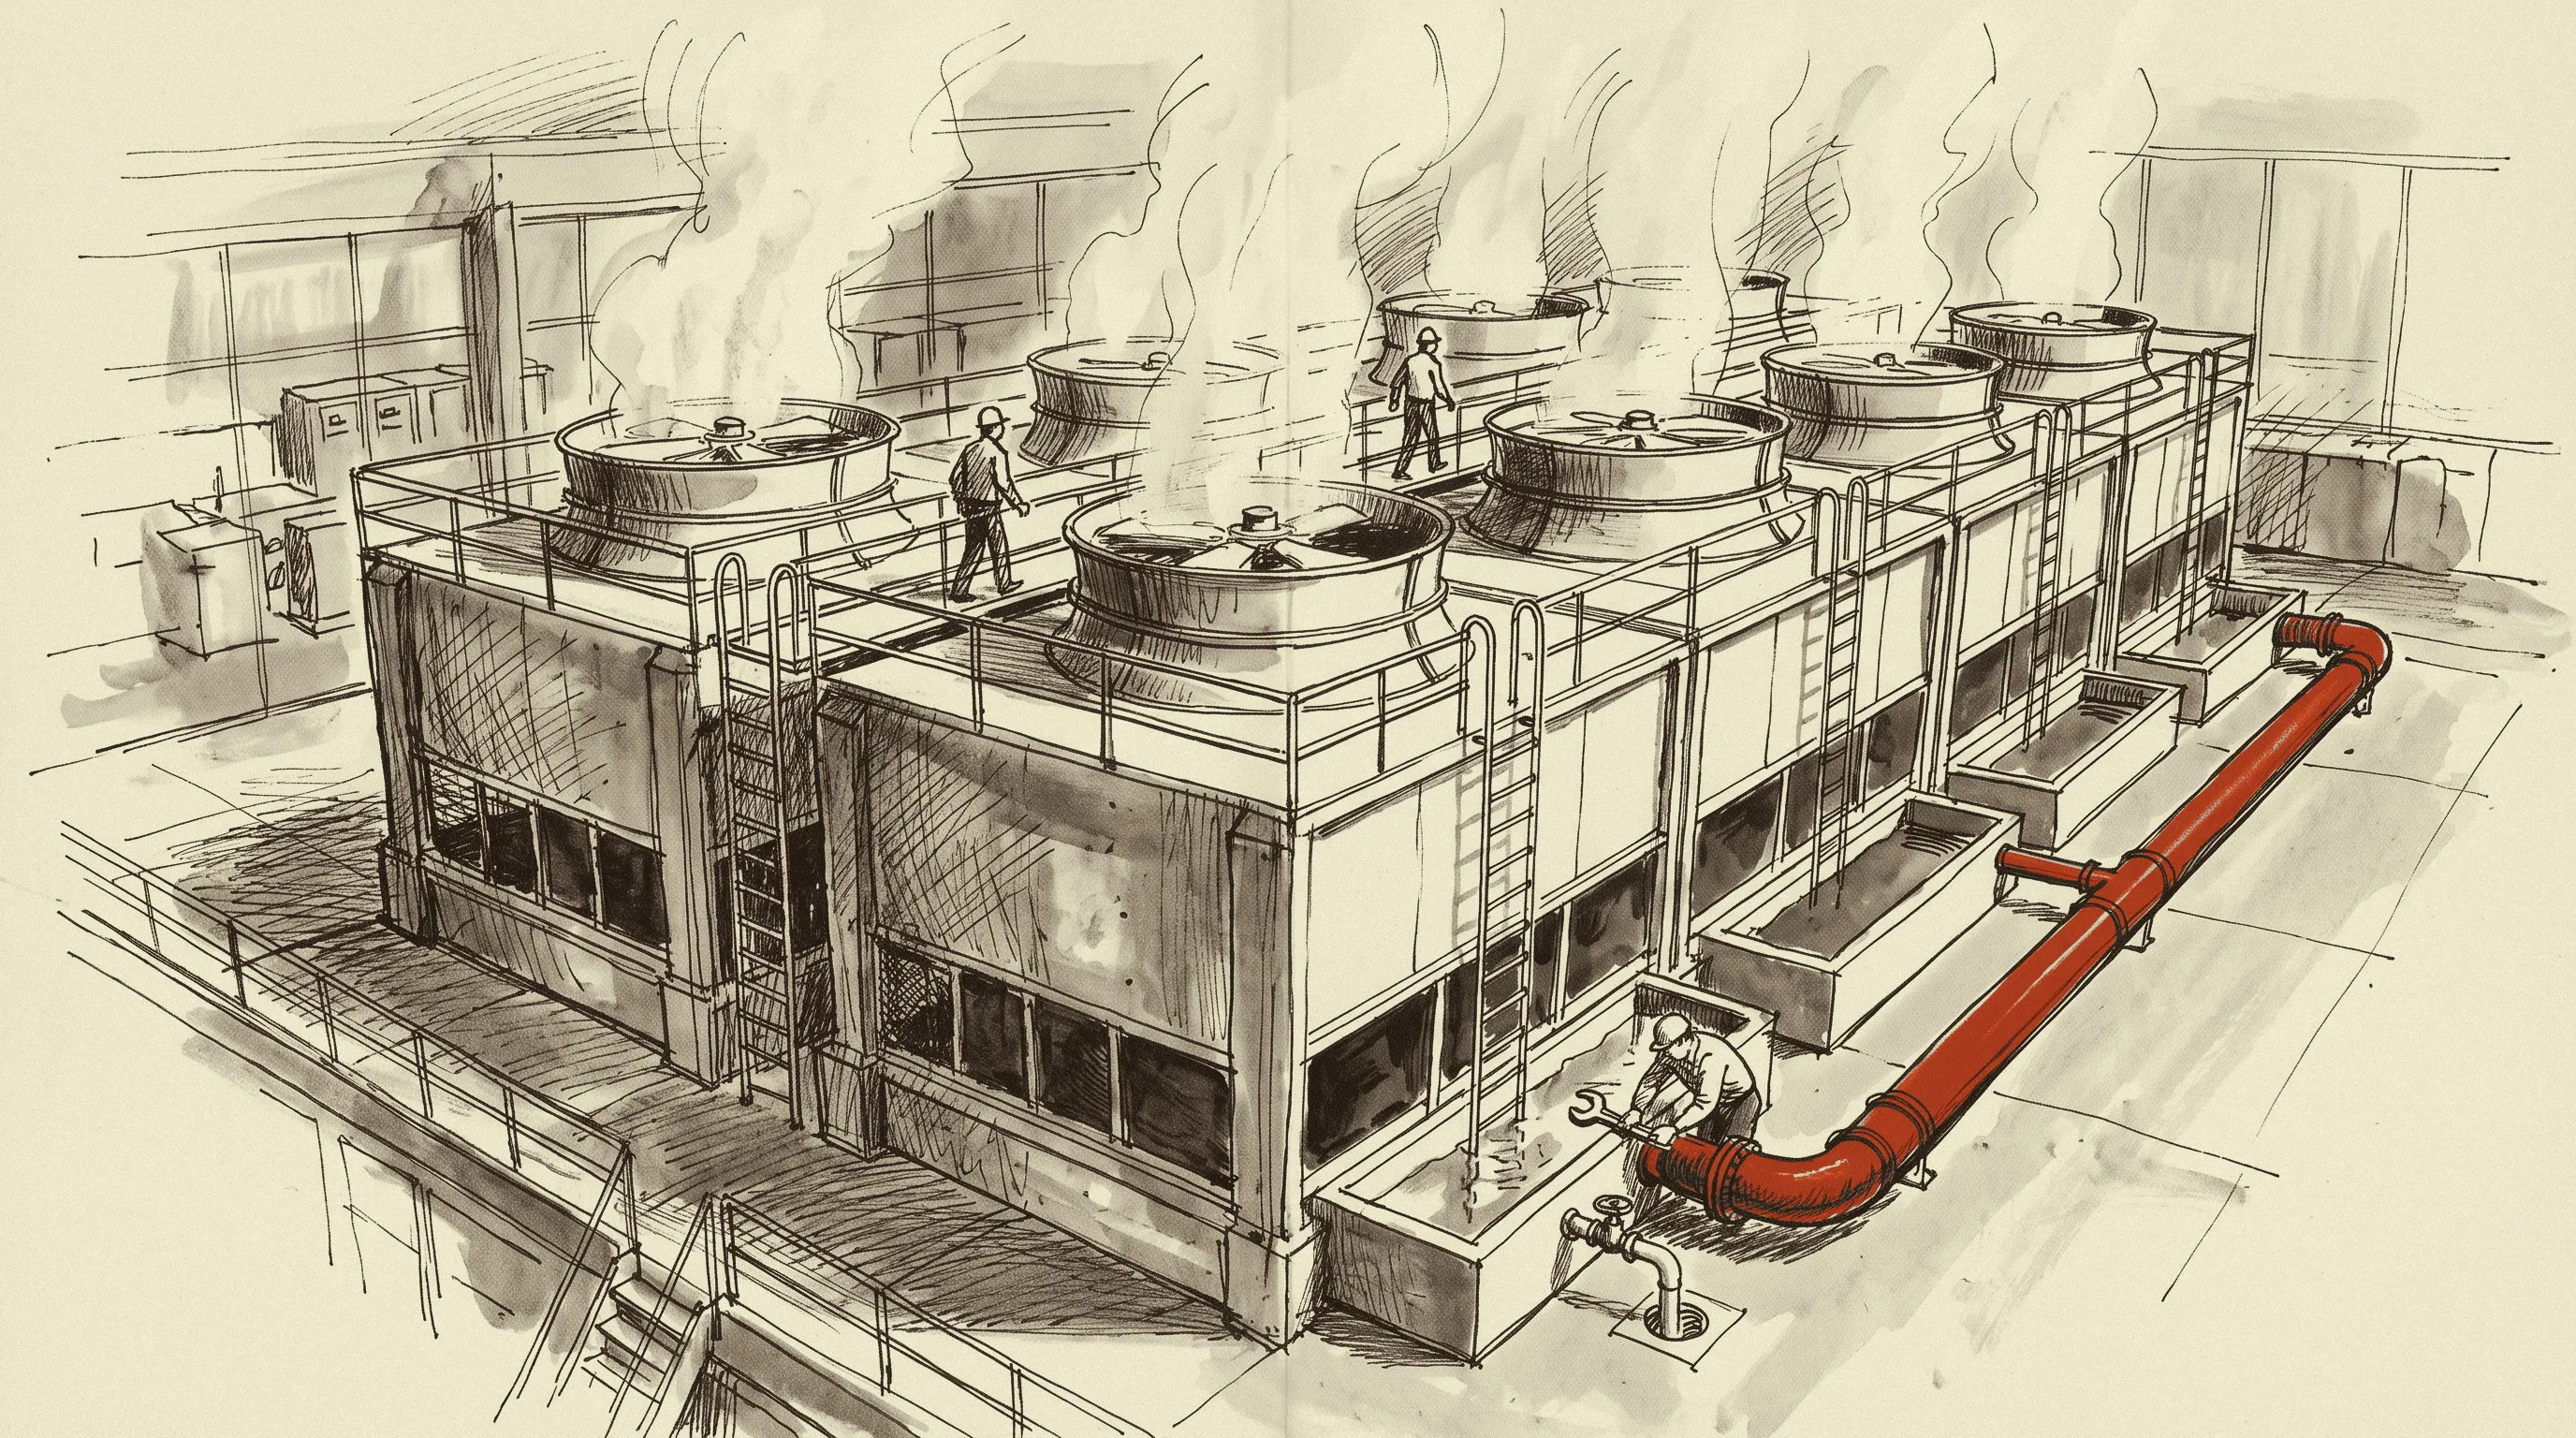
An evaporative tower rejects heat by boiling off part of the water it circulates. The EPA’s WaterSense guide puts the figure at approximately 1.8 gallons evaporated for every ton-hour of cooling, regardless of tower efficiency, and the WaterSense at Work chapter on towers states the same physics as 1 percent of recirculating flow for every 10F of range. One MW of heat is 284 tons, so a tower running flat out for a year evaporates 4.48 million gallons per MW. The dissolved solids stay behind, so the tower bleeds concentrated water to the drain to keep scale off the fill. The FEMP best-practice sheet gives the relationship: blowdown equals evaporation divided by cycles of concentration minus one, and the EPA notes that many systems operate at two to four cycles.
At four cycles, a tower draws 5.98 million gallons of makeup per MW-year and sends 1.49 million of them to the sewer. Loudoun Water, the utility under Ashburn, builds the same assumption into its tariff: its estimated-flow table for a water-cooled data center assumes a 25% blow down to sanitary sewer, which is four cycles exactly. SemiAnalysis’s cooling anatomy arrives at the same order of magnitude from the other direction: a 50 MW datacenter at 60% utilization, PUE 1.25 and a WUE of 2.0 uses 174 million gallons a year, and at full load with the heat of the chillers added the figure climbs toward our 300 million.
The sewer half of the bill depends on one piece of hardware. Most utilities bill sewer on metered water in, unless the customer installs a deduct meter on the makeup line that proves the evaporated gallons never reached the drain. Salt Lake City bills sewer on a flat 70% of total water consumption, Douglas County on 80%, Phoenix as 88% of January-to-March water, and Chicago at 100 percent of the water charge with no evaporation credit at all. A tower billed sewer on all of its intake pays treatment on water that left as vapor.
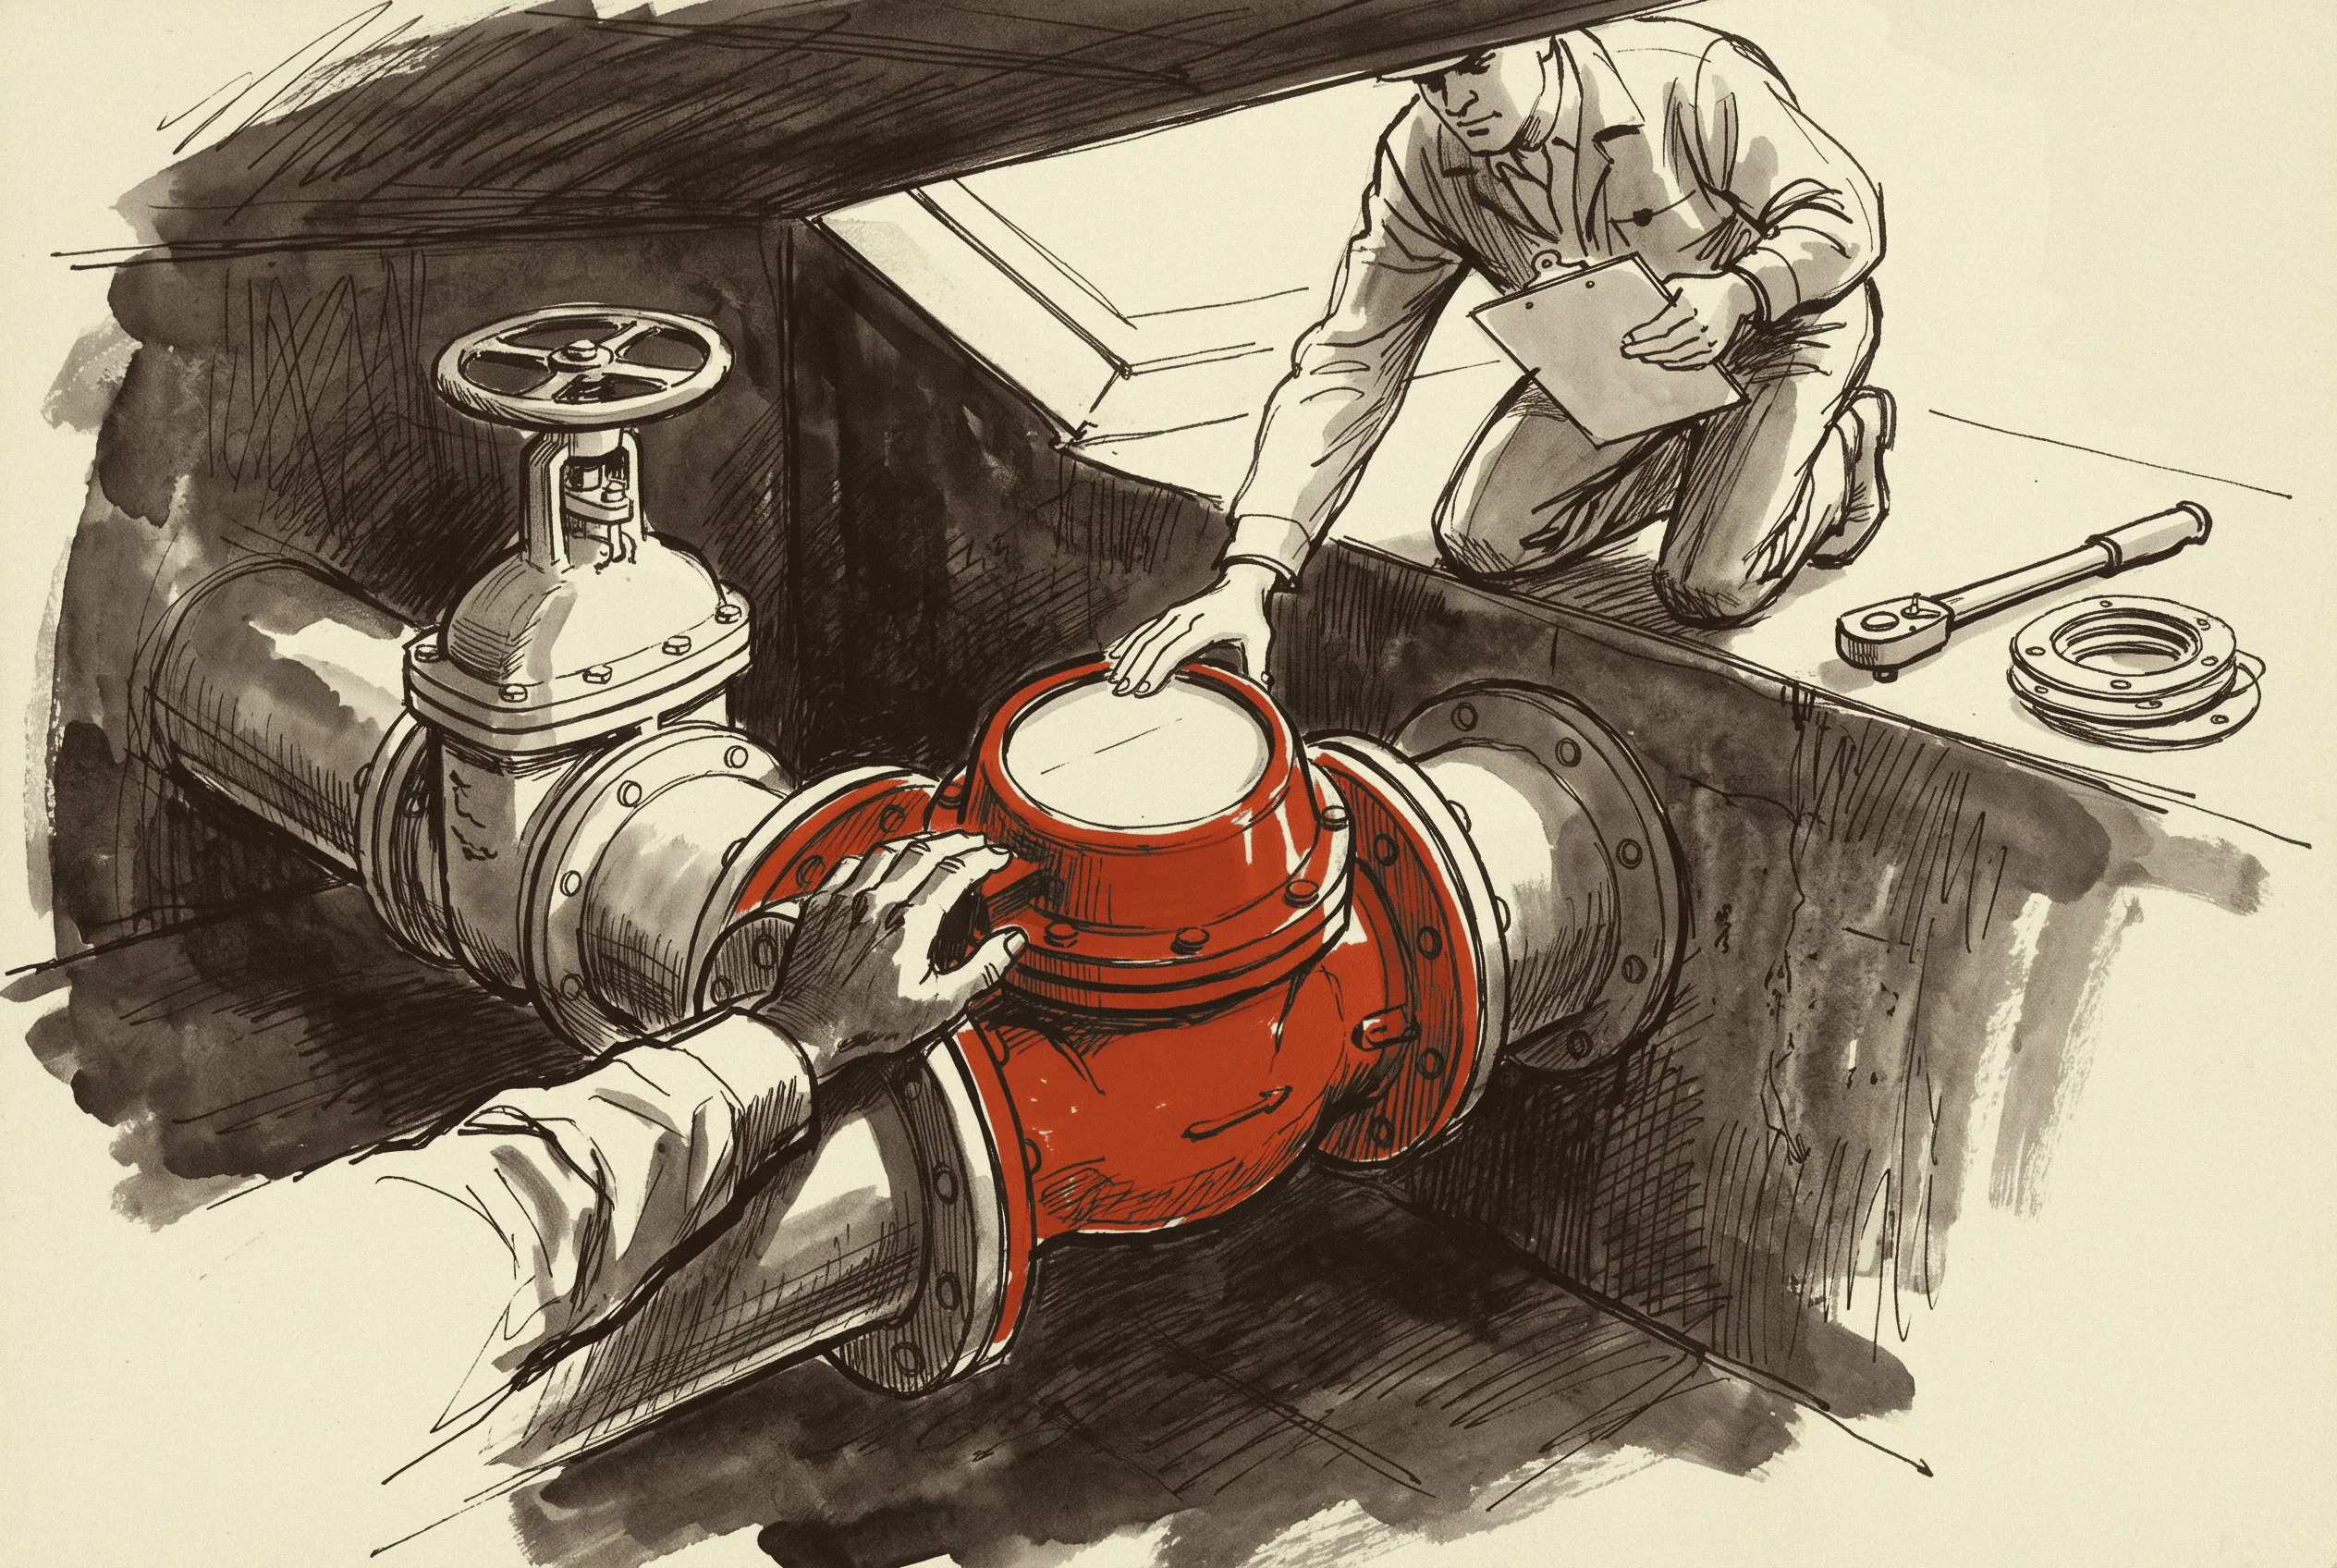
With a deduct meter and four cycles, the bill per MW-year is $102,295 in Santa Clara, $91,311 in Douglas County, $73,467 in Houston, $56,296 in Phoenix, $36,270 in Northern Virginia and $19,740 in Baton Rouge. Without the deduct meter the fifteen numbers run from $51,882 to $148,250, with every row in tower-water-cost-per-mw-year.csv. For 50 MW the deduct-meter case is $5.1 million a year in Santa Clara and $1.0 million in Baton Rouge. The Large-Load Interconnection Cost tool prices the electric side of the same fifteen connections, and the water line now sits beside it.
Fifteen Tariff Sheets, One Table
We opened the current rate sheet or ordinance for one water utility in each market, took the volumetric rate a user drawing millions of gallons a month pays on its last gallon, and converted hundred-cubic-foot rates at 748 gallons. The utilities match the markets in What 50 MW Costs in 15 US Markets: the data center cluster inside each electric territory.
| Market | Utility | Water $/kgal | Sewer $/kgal | Combined | Effective |
|---|---|---|---|---|---|
| Atlanta (Douglas County) | Douglas County WSA | 12.10 | 12.70 | 24.80 | 2025-12-01 |
| Bay Area (Santa Clara) | City of Santa Clara | 14.83 | 9.13 | 23.96 | 2026-07-01 |
| Houston | Houston Public Works | 9.34 | 11.80 | 21.14 | 2026-04-01 |
| Salt Lake City | Salt Lake City DPU | 4.70 | 14.67 | 19.37 | 2026-07-01 |
| Carolinas (Charlotte) | Charlotte Water | 4.88 | 9.20 | 14.08 | 2026-07-01 |
| Columbus | Columbus DPU | 5.11 | 8.84 | 13.95 | 2026-01-01 |
| Northern Indiana (Fort Wayne) | Fort Wayne City Utilities | 3.65 | 9.66 | 13.31 | 2026-06-22 |
| Phoenix (APS) | Phoenix Water Services | 8.28 | 4.55 | 12.83 | 2025-03-01 |
| Phoenix (SRP) | City of Mesa | 5.39 | 6.47 | 11.86 | 2026-04-01 |
| Northern Virginia | Loudoun Water | 4.42 | 6.59 | 11.01 | 2026-01-01 |
| West and South Texas (Abilene) | City of Abilene | 6.73 | 4.19 | 10.92 | 2026-10-01 |
| Dallas-Fort Worth | Dallas Water Utilities | 5.11 | 5.15 | 10.26 | 2025-10-01 |
| Chicago | Chicago DWM | 4.98 | 4.98 | 9.96 | 2026-06-01 |
| Colorado (Denver) | Denver Water, Denver DOTI | 3.55 | 5.88 | 9.43 | 2026-01-01 |
| Louisiana (Baton Rouge) | Baton Rouge Water, EBR sewer | 1.51 | 7.17 | 8.68 | 2026-01-01 |
Source: Open Factory Datacenter MEP Cost Table. CSV with the tier, basis and tariff URL for each row: water-sewer-rates-by-market.csv
The top of the table is a tier structure, not a scarcity premium. Douglas County has no commercial class at all and scales its three tiers with meter size, so an 8-inch meter pays $12.10 on every gallon over 640,000 a month, which for a tower is every gallon. Santa Clara charges one potable rate of $11.09 per hundred cubic feet to every class and bills sewer at $6.83 per hundred cubic feet on 90% of metered water for industrial users not otherwise classified. Houston’s April 2026 schedule lists $9.34 for water and $11.80 for wastewater per thousand gallons on all commercial and industrial volume.
The bottom of the table is cheap water with expensive treatment. Baton Rouge Water Company’s commercial tail block is $1.13 per hundred cubic feet in the Louisiana PSC’s July 2026 comparison, while the parish sewer ordinance adopted in February 2026 charges $7.169 per thousand gallons and escalates 4% every January from 2027. Fort Wayne’s declining block, approved by the Indiana commission in June 2026, prices all usage over 50,000 cubic feet at $2.73. Denver’s Tier 1 is $3.55 per thousand gallons up to the customer’s average winter use, which a flat load never exceeds, so the $2.20 drought adder on Tier 3 from June 2026 does not reach it.
Two of the fifteen utilities already sell a second, cheaper pipe to the same meter. Loudoun Water prices reclaimed water at $2.07 per thousand gallons against $4.42 potable, delivered more than 750 million gallons of it to roughly 40 customers in 2025, and the county says data centers draw 9% of total potable water on an average day. Denver sells recycled water inside the city at $1.20 per thousand gallons, a third of the potable Tier 1, and Santa Clara at $6.05 per hundred cubic feet, a 45% discount. Google’s Douglas County site shows what the purple pipe does to a bill: 440.6 million gallons withdrawn in 2025, 394.3 of them reclaimed.
What the Disclosures Say the Fleet Draws
Three operators publish enough to check the EPA arithmetic against metered sites. Google’s 2026 environmental report lists 1,746.4 million gallons withdrawn at Council Bluffs, 1,396.7 at Mayes County, 1,008.1 at New Albany, 263.6 at Midlothian, 258.4 at Sterling and 19.4 at Mesa, Mesa being one of eight sites footnoted as air-cooled. Fleet consumption was 10.9 billion gallons in 2025, up 34%. Google publishes no liters-per-kWh figure. Its 2022 cooling post said the average Google data center consumed approximately 450,000 gallons of water per day in 2021, which at our full-load rate is a 27 MW tower plant.
New Albany’s 1,008.1 million gallons at the Columbus rate of $13.95 per thousand is a $14 million bill before any deduct credit, the three Loudoun towns drew 573 million gallons together, and Mesa’s 19.4 million is 1.1% of Council Bluffs. Microsoft and Meta publish the ratio Google withholds. Microsoft’s efficiency page lists a global WUE of 0.27 L/kWh for FY25 and 0.34 for the Americas, and its 2026 data fact sheet lists electricity and water by location, which divides to 1.03 L/kWh at Phoenix, 0.55 at Chicago, 0.29 at San Antonio and 0.12 at Boydton. Meta’s data index puts its 2024 fleet at 0.19 L/kWh, and its Fort Worth site at 311 megaliters against 1,109,004 MWh, or 0.28.
The ladder runs 2.58 L/kWh for the EPA tower rule at four cycles, 2.30 for Microsoft’s own first-generation sites, 1.03 at Microsoft Phoenix, 0.36 for LBNL’s 2023 US fleet average, 0.28 at Meta Fort Worth, 0.19 for Meta’s fleet and zero for the design Microsoft is piloting. Microsoft’s June 2026 post states that its average WUE fell from 2.3 L/kWh to 0.27 in 2025, that about 90% of the owned fleet runs low-to-zero-water cooling, and that those sites rely on water only when outside temperatures exceed 85F. The 2.3-to-0.27 drop is the whole argument of this piece: it came from changing the heat-rejection machine, and the water bill it removed is the one charted above. LBNL’s December 2024 report for DOE puts the US fleet at 66 billion liters of direct consumption in 2023 and 60 to 124 billion liters for hyperscale alone by 2028, with the highest WUE at water-cooled chiller plants without economizers. The Cooling Roadmap tracks the inlet temperature each rack generation permits, which is what lets a site move down the ladder.
Wet-Bulb Hours Decide the Tower
A tower can only cool water to within a few degrees of the ambient wet bulb. We took the NREL TMY3 weather file for the airport nearest each market, computed the hourly wet bulb from dry bulb, dew point and station pressure, and counted the hours above 70F, where a tower selected at the CTI 78F standard starts losing approach and the chiller behind it works harder. We ran the same count on the TMYx files built from 2009 to 2023 observations.
Houston counts 3,339 hours above 70F in TMY3 and 3,732 in the 2009 to 2023 file, Baton Rouge 2,959 and 3,584, Dallas 2,589 and 2,566, Atlanta 1,566 and 1,866, Phoenix 833 and 1,137, Northern Virginia 967 and 927, Columbus 538 and 818, and Denver, Salt Lake City and San Jose 0 to 15 hours in either file, every station and threshold in wet-bulb-hours-by-metro.csv. The 0.4% design wet bulb, the figure a tower is selected against, runs from 64.5F in Salt Lake City to 80.8F in New Orleans in TMY3 and is 2 to 5F higher in the 2009 to 2023 files for Houston, Atlanta and Baton Rouge.
The Gulf Coast markets with the most wet-bulb hours are where a tower works hardest and a dry cooler works worst, because dry bulb and wet bulb sit close together and neither machine gets much help from the air. A tower in Salt Lake City evaporates the same 1.8 gallons per ton-hour as one in Houston. What changes with the wet bulb is the approach and the chiller behind it, not the water.
Dry-Bulb Hours Decide the Dry Cooler
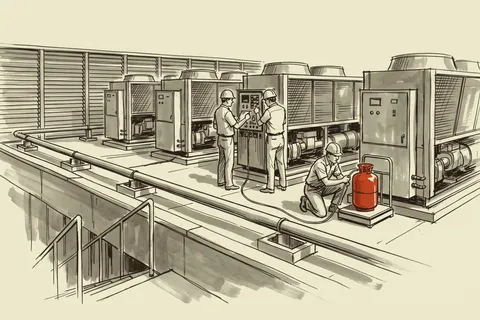
A dry cooler is a finned coil with fans, and it can only cool fluid to within an approach of the dry-bulb temperature. Evapco rates its eco-Air series at 110F entering and 100F leaving at 92F dry bulb, an 8F approach, and a Guntner selection in a Massachusetts bid package is 115F to 100F at 95F dry bulb. A loop at the ASHRAE W32 class, supply at or below 32C, or 89.6F, cannot be held by an 8F-approach dry cooler once the air passes about 82F, and that is where a hybrid turns on its spray. Microsoft’s hybrid fleet uses water only when outside temperatures exceed 85F, the same threshold with a slightly warmer loop.
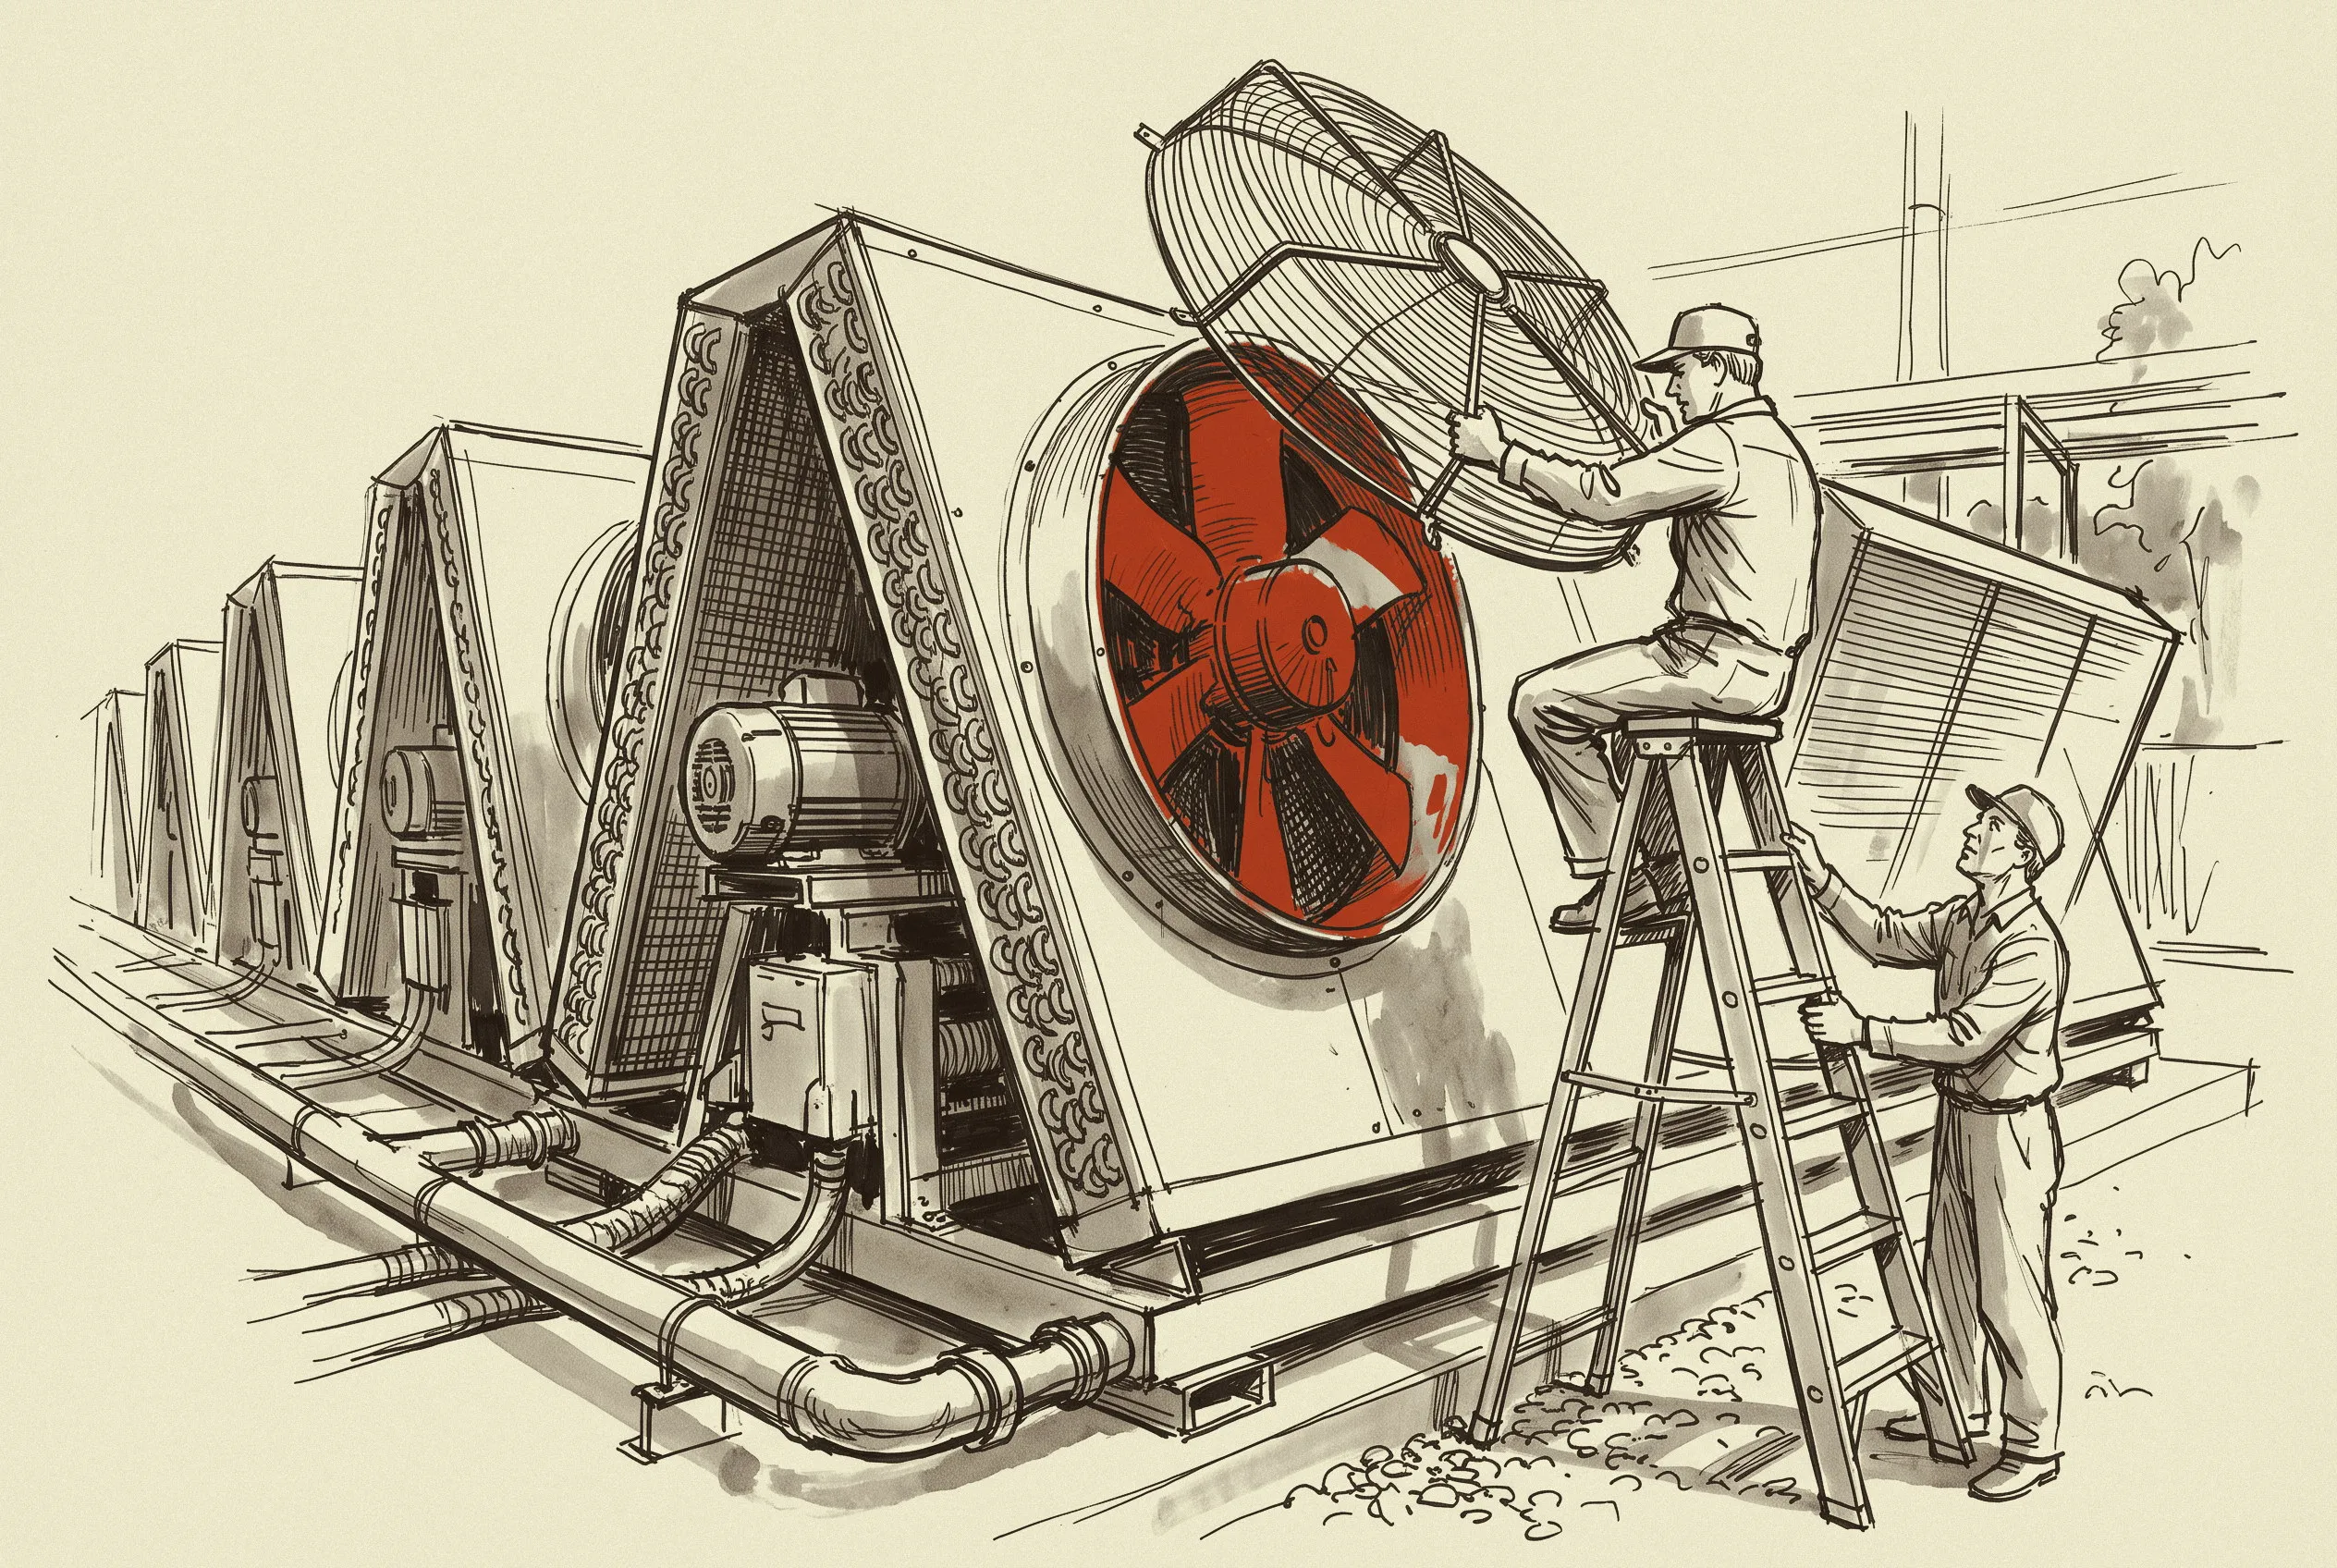
Phoenix counts 2,800 hours above 85F dry bulb in TMY3 and 3,127 in the 2009 to 2023 file, Dallas 1,143 and 1,443, Houston 958 and 1,343, Abilene 906 and 1,281, Atlanta 564 and 613, Northern Virginia 296 and 381, Columbus 69 and 221, and San Jose 48 and 76. Phoenix is the one market with few wet-bulb hours and many dry-bulb hours, the hybrid’s home climate: wet assist on 36% of hours, dry on the rest. Microsoft’s Phoenix WUE of 1.03 L/kWh is that climate metered, 40% of the open-tower figure, after a 23% year-over-year improvement in FY25.
The price of dry rejection is fan power, and four manufacturers publish enough to measure it.
The Marley NC Everest NC8422R-1 lists 1,311 tons on a 25 hp motor, 4.0 kW per MW, the Evapco AT 312-2I36 851 tons on three 10 HP fans, 7.5 kW, and the BAC Series 3000 S3E-1424-14W 1,394 tons on 125 HP, 19.0 kW, all at the CTI 95F, 85F and 78F wet-bulb basis. The Evapco eco-Air EAW-DD 33S3 rejects 7,130 MBH on 120 HP, 43.1 kW per MW, and the twelve-fan EAW-DD 1512 rejects 8,330 MBH on 278 HP, 84.8 kW per MW, at the same 92F dry bulb. Those are nameplate figures at the rating point. Over a year the fans slow on every cooler hour, and the pumps and chiller behind a tower, excluded from the chart, draw more than its fans do. Amazon says evaporative systems cut operational energy use 25% to 35% during peak summer periods, and a 2022 study of two Phoenix colocation sites found the air-cooled one ran about 13% higher PUE for 66% lower source WUE. Uptime’s April 2026 briefing argues that well-designed dry and adiabatic systems can match evaporative PUE across ASHRAE climate zones 2 to 6, which holds where the loop is warm enough to need no chiller.
The Fan Penalty and the Breakeven
No manufacturer publishes a dry cooler price, and none of the 2025 and 2026 bid tabulations we opened priced one against its capacity. Towers are documented. South Carolina’s Department of Veterans’ Affairs put a 370-ton tower replacement with condenser pumps and controls at $625,000 to $700,000 in September 2025, $1,690 to $1,890 per ton installed, and Brownsville’s utility valued the replacement tower for two 1,000-ton chillers at $1,770,769 in October 2025, about $885 per ton. Thunder Said Energy’s model uses $1,000 per ton installed, $300 per kW of heat, with installation about 60% of it, and Delta Cooling’s own FAQ quotes $120 to $200 per ton for the equipment. Evapco raised list prices on towers 3% and on dry and adiabatic coolers 4% from January 5, 2026. The Public Bid-Tab Price Book holds these awards as its first heat-rejection rows, and Quote Check flags a tower quote outside the $885 to $1,890 per ton band until more awards land.
So we inverted the question and asked what premium the tower’s water bill would pay for. We priced the fan penalty at the difference between the Evapco eco-Air 33S3 and the Evapco AT 112, 27.7 kW per MW at design, averaged to half of that over the year, at each state’s July 2026 industrial electricity rate, 7.07 cents in Texas, 10.07 in Virginia and 25.11 in California. The half-load average and the exclusion of tower pumps are our assumptions, marked (A) in the CSV. Both favor the tower.
Ten years of water and sewer come to $1,023,000 per MW in Santa Clara against a $305,000 fan penalty at California’s rate, $913,000 against $122,000 in Douglas County, $735,000 against $86,000 in Houston, $563,000 against $113,000 in Phoenix, $363,000 against $122,000 in Northern Virginia and $197,000 against $74,000 in Baton Rouge. The net ten-year saving from going dry is $791,000 per MW in Douglas County, $718,000 in Santa Clara, $649,000 in Houston and $450,000 in Phoenix under APS, and below $250,000 in Northern Virginia, Chicago, Denver and Baton Rouge. At a premium of $200 per kW of heat, two thirds of Thunder Said’s installed tower cost, the dry plant pays back in 2.5 years in Douglas County, 2.8 in Santa Clara, 3.1 in Houston, 4.4 in Phoenix, 8.3 in Northern Virginia and 16.2 in Baton Rouge, with every market and three premium scenarios in dry-cooler-breakeven-by-market.csv. A buyer who signs the 14-year Dominion contract in the Large-Load Cost Table and installs a tower in Loudoun is making a defensible call. The same buyer in Douglas County is not.
The hybrid changes the arithmetic in one market. If a hybrid cooler sprays only on the hours above 85F dry bulb, its water bill scales with those hours, which gives $20,096 per MW-year in Phoenix, $11,263 in Houston, $6,390 in Douglas County and under $2,000 in Northern Virginia, Columbus, Chicago and Santa Clara. In Phoenix that is 36% of the tower bill, and in Columbus 2.5%, which is why a hybrid is the rational Phoenix machine and an unnecessary one in Ohio. Lead times do not decide between them this year. Linesight’s June 2026 tracker puts chillers, CRAHs and cooling towers within circa 20 to 43 weeks, while the Lead-Time Monitor lists Origin Partners’ 50 to 70 weeks for water-cooled chillers over 1,000 tons, the subject of Chillers Are the 60-Week Problem.
The Fights Are About Permits, Not the Bill
The water fights of 2026 are not tariff disputes. In Fayette County, Georgia, two industrial hookups feeding QTS’s Project Excalibur campus had been billed wrongly, and by the time the error was found QTS had consumed more than 29 million gallons and paid $147,474 in retroactive charges at a $6.46 construction rate, as Fortune reported in May. Twenty-nine million gallons is five weeks of a 50 MW tower. In Tucson the city demanded that the Project Blue developer replace two acre-feet, about 650,000 gallons, trucked out of city limits by a contractor, less than a day of a 50 MW tower. The headline volumes are small against Google’s table. The politics turn on who was told, not on what was paid.
The rules that bind are written into the tariffs as thresholds. Phoenix’s March 2024 ordinance requires any new user above 250,000 gallons a day to file a conservation plan, and above 500,000 to meet 30% of demand with recycled or conserved water. A 50 MW tower draws 820,000 gallons a day at full load, so it crosses both lines, and under the hybrid arithmetic above it crosses neither. Mesa’s rate book adds a $2.96 per thousand gallon surcharge on use above the customer’s December-to-February average, which a flat tower load avoids and a hybrid, which sprays in summer, does not. The Large-Load Policy Tracker lists these alongside the electric rules. In Abilene, where the Stargate campus sits in AEP Texas territory, the city told the Texas Tribune the site would initially use 8 million gallons of city water to fill its cooling system, and the developer’s chief executive told a Senate committee the running draw would be less than 25,000 gallons a day. That is a closed loop with dry rejection, and it is what a buyer in West Texas should expect to be asked for.
Certification is the other thing a specification should include. The Cooling Technology Institute’s STD-201 program certifies that all models of a line of evaporative heat rejection equipment will perform thermally in accordance with the manufacturer’s published ratings, and its test agency confirms the program now covers open and closed-circuit towers and dry coolers, with adiabatic coolers under development. A hybrid bought today is bought on the vendor’s own curve, which the OEM Disclosure Scorecard scores for Evapco, BAC and SPX: a certified rating counts, a brochure percentage does not.
What to Do Monday
Pull the water tariff before the electric one is signed, because the water bill is the one you can still design around. Ask for the rate code a large meter lands in: Douglas County’s 8-inch Tier 3, Dallas’s Optional General Services at $5.11 above the first million gallons, Fort Wayne’s over-50,000-cubic-foot block, Loudoun’s Tier 1 within reserved capacity. Then ask in writing whether a sewer deduct meter is permitted on the makeup line, whether a reclaimed line reaches the parcel and at what rate, and what the large-user threshold is in gallons per day.
Write cycles of concentration into the treatment contract as a floor, not a target. The EPA’s own figure is that moving from three to six cycles cuts makeup 20% and blowdown 50%, and where sewer costs more than water, as in Salt Lake City, the blowdown half of that is the larger saving. Specify CTI STD-201 certification for any tower or dry cooler, and ask the hybrid vendor for a test report under the adiabatic code once CTI publishes it. Push the facility water class as high as the IT will take, because a W40 loop lets the fans do the work the water did. How Hyperscalers Buy Chillers and Colo Developers Do Not covers the owner-furnished route, and the Lead-Time-Adjusted Schedule puts the 20-to-43-week tower slot against the 50-to-70-week chiller slot so the two arrive in order.
Behind the paywall: the 50 MW heat-rejection bill of materials three ways, open tower, dry and hybrid, with the per-MW lines for equipment, installation, fans, water and treatment. The four markets where leaving the tower pays back inside 4.4 years at a $200 per kW premium and the five where a tower should stay. The six-vendor shortlist with what each publishes, and the five clauses for the water service agreement, all tied to the component lines in the Datacenter MEP Cost Table.